Quadratics
Vertex Form
Formula
y = a(x – h)2 + k
Key terms
-
Vertex
-
Zereos
-
intercepts
-
Optimal value
-
Axis of symmetry
The formula Above represents the equation
of a given parabola in vertex form. The `y`
stands for the parabola.
The `a` stands for
whether the parabola opens upwards or downwards and if its vertically stretched or compressed. We can determine this on two things, if the `a` value is is greater then one, we call it vertically stretched, if it is less then one it is vertically compressed. We can also tell if the parabola is going to open upwards or downwards depending on if the `a` value is negative or positive. For example if the `a` of a given parabola was 0.25 we can figure out that the parabola is going to be facing downwards and is compressed by the factor of 0.25.
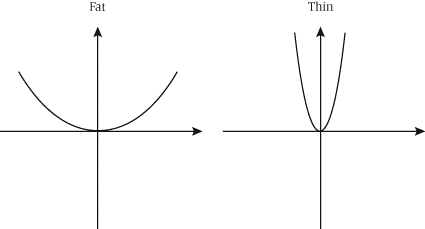
The fat is vertically compressed, the thin
is vertically stretched.
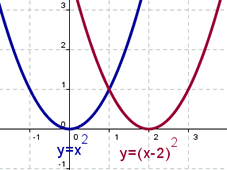
`h` value represents
the horizontal shift, so how many units left or right along
the x-axis the vertex is. But the trickey thing is the numbers
are opposite, so if the `h` value is +5 then the parabola is
horzintally shifted 5 units to the left, but if it is -5 then
the parabola is shifted 5 units to the right.
The 'k' value represents
simply stands for how many units the parabola has shifted along the y axis. If the
number is a positive number it has moved upwards along the y-axis and when it is
negative, it has moved down along the y-axis. For example if the equation had a 8 as its 'k' value, you can tell that the parabola for the given equation has moved up 8 units. If it was -8, you would know that the parabola has moven 8 units downwards.
Graphing
When graphing a parabola you need to understand
that the axis of symmetry is the 'h' value in the equation,
and the optimal value is the 'k' value. The axis of
symmetry is the 'x' value of the vertex and the optimal
value is the 'y' value of the vertex. For example if the
equation of the line is y= 2(x-4)2- 3, you would know the
vertex of the parabola would be (4,3). Now to figure out
how the rest of the graph will look like we will now watch
a video on a simple example.
To find points for the graph you must plug in x values to figure out the y values. So if the vertex is (4,3) your next x value would be 5 to figure out the y value, you take the 5 and plug it in. so
y=2(5-4)2-3
y=2(1)-3
y=-1
The next point would be (5,-1) and the same point would be plotted on the other side of the vertex.
For more help on step patterns please feel free to refer to the video above!


